- A if the state is close to parity (at least 90%),
- B for states that have achieved 80 to 89%,
- C for states that have achieved 70 to 79%,
- D for states that have achieved 60 to 69%, and
- F for states that are below 60%.
Gavel Gap
The differences between the race & gender composition of the courts & the communities they serve.
by Tracey E. George and Albert H. Yoon
The Gap
For the first time, researchers have gathered data on the demographics of state court judges in all 50 states.
They found troubling differences between the race and gender composition of the courts and the communities they serve.
We call this disparity the Gavel Gap.
Report Card
#GavelGap
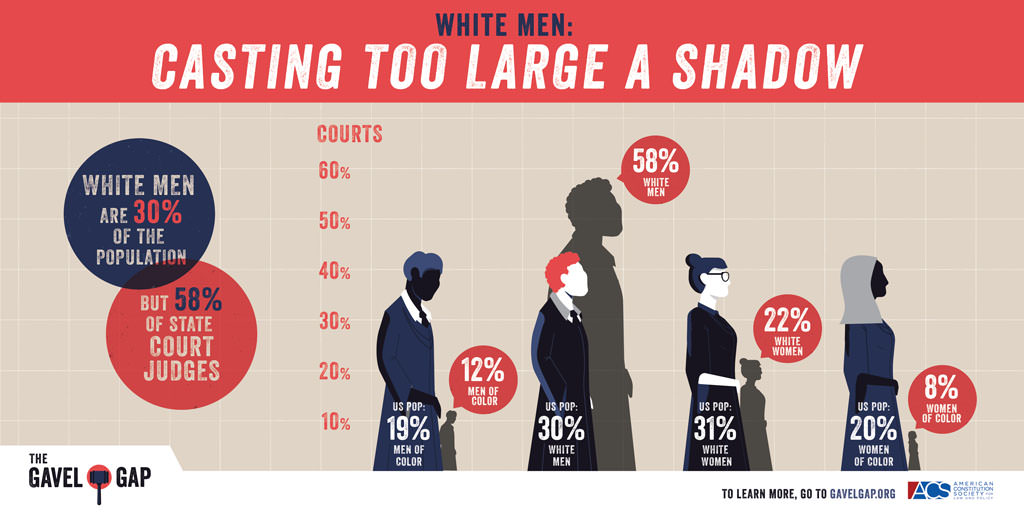
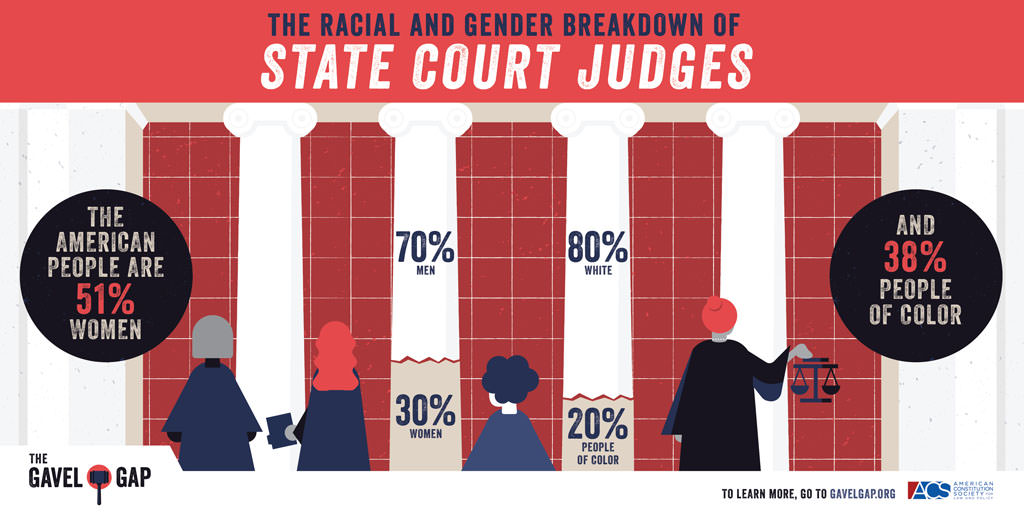
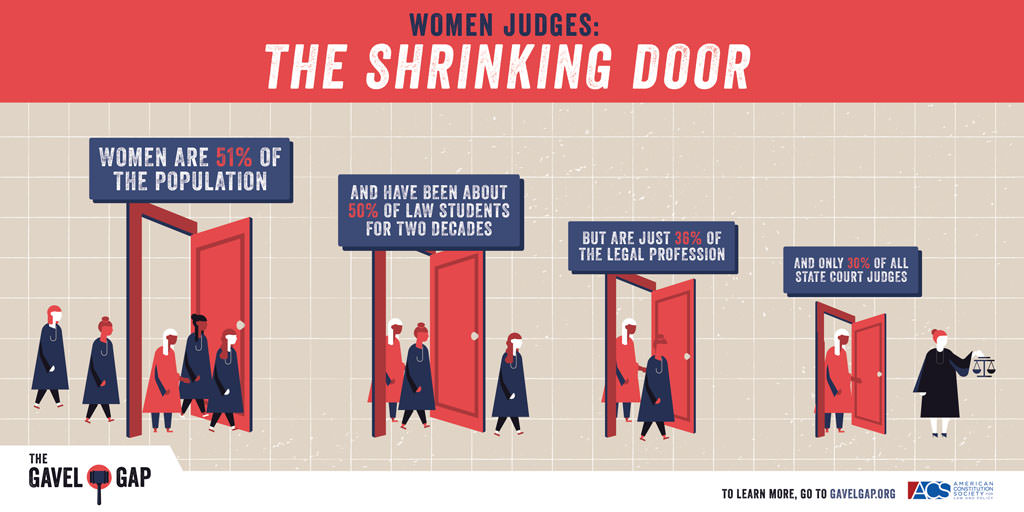
Women are half of the population – but less than a third of state judges. It’s time to close the #GavelGap.
People of color are 40% of the population, but less than 20% of state judges. Close the #GavelGap.
When 90% of US cases are tried in state courts, diversity matters. #GavelGap.
Download Data & Report
 For most people, state courts are the “law” for all effective purposes. But we know surprisingly little about state court judges, despite their central and powerful role. Unlike their counterparts on the federal courts, much of the relevant information is non-public, and in many states, not even collected in a systematic way. This lack of information is especially significant because judges’ backgrounds have important implications for the work of courts and the degree to which the public has confidence in their decisions.
In order to address this serious shortcoming in our understanding of America’s courts, we have constructed an unprecedented database of state judicial biographies. This dataset—the State Bench Database–includes more than 10,000 current sitting judges on state courts of general jurisdiction in all 50 states. We use it to examine the gender, racial, and ethnic composition of state courts, which we then compare to that of the general population in each state. We find that courts are not representative of the people whom they serve. We call this disparity The Gavel Gap.
Methodology
We collected biographical data for every judge sitting on a state appellate court or a state trial court of general jurisdiction as of December 2014. When constructing our dataset, we used only sources that had the hallmarks of credibility and reliability. The sources included state government webpages, press releases, and printed directories; professional association, practitioner, and university publications; academic journals; newspapers; judges’ official campaign websites; judicial directories; and confidential telephone interviews with judges and lawyers.
A note about our calculation on the numbers of women and minorities on the bench. First, our figures are estimates. We are not directly observing these characteristics of the judges but rather collecting it from secondary sources. Second, even after exhausting available sources, we are missing race and ethnicity data on roughly five percent of the judges. We were able to identify gender for nearly all of the judges in the database. Our estimates are based on available data. Third, the database includes only judges who were listed as serving on the court in December 2014. If a state experienced significant turnover in its composition of judges in the interim, our figures may contrast with the state’s current judicial composition.
For every state, we calculated the gap between the representation of women and minorities on the bench and the representation of these groups in the general population. We calculate the Gavel Gap by dividing the difference between the proportion of women and minorities on the bench and women and minorities in the general population by the proportion of women and minorities in the general population. The Gavel Gap = ((fraction of judges who are women and/or minoritiesminus fraction of general population who are women and/or minorities) divided by fraction of general population who are women and/or minorities). Thus, if half of a state’s judges were women and/or minorities and half of its general population were women and/or minorities, the state would have no gap ((.50-.50)/.50=0). If ten percent of a state’s judges were women and/or minorities and half of its general population were women and/or minorities, the state would have a gap of -.80 ((.10-.50)/.50=-.80). That is, the state has 80% fewer women and/or minorities on the bench than we would have predicted based on its general population. Stated differently, the state has only 20% of the number of women and/or minorities on the bench as we would expect.
The Representativeness Score is a positive presentation of where a state stands on achieving the proportion of women and/or minorities on the bench as it has in its general population. We rank each state based on the level of representation that it appears to have achieved based on the State Bench Database estimates. We grade a state as follows:
For the first time, researchers have gathered data on the demographics of state court judges in all 50 states. They found troubling differences between the race and gender composition of the courts and the communities they serve. We call this disparity the Gavel Gap.